Actionable Data for ROI
Intelligent data ecosystems are often complex and critically important components of an organization’s technology suite, affording managers the ability to operate with the best information in order to set and manage realistic goals.
Advanced Data Visualization
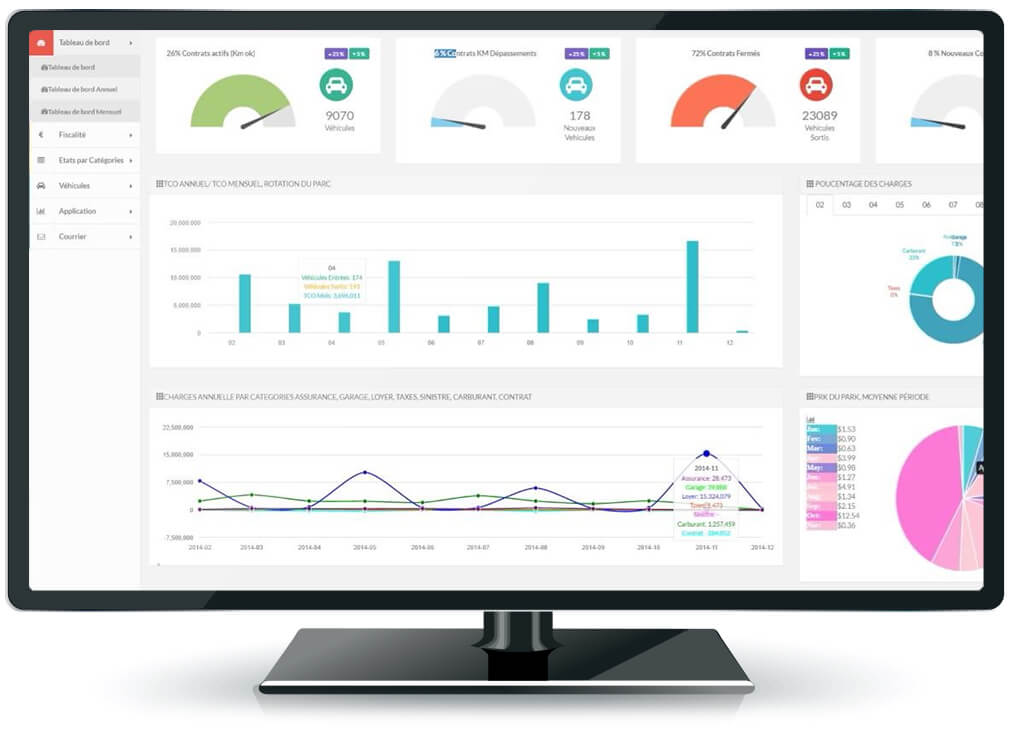
While GSatTrack does an excellent job of organizing the visual representation of live data for most operational needs, the advanced features of the platform are those that allow managers to manipulate the data within the interface, and to set up custom views that allow managers to isolate only the data most important to them. This includes taking full advantage of the asset grouping functionality to isolate and compare assets by type, geo-region, and a number of other comparable attributes.
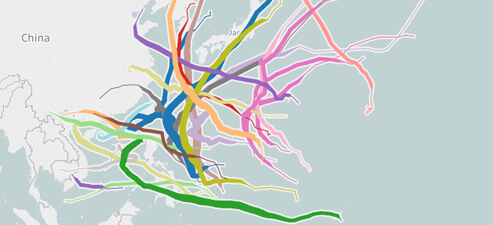
Custom map layers can also be created that show only assets of a particular type, or data from external APIs in the UI with the assets in real time. This functionality, for example, can help managers understand the threat of weather events on assets that may need to be alerted or diverted, and it can also be employed to automate those alerts based on geofences.
Enhanced Dashboards
Near-real-time relevance
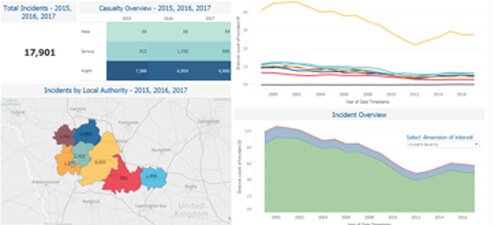
The full value of advanced data processing and reporting can be leveraged by intelligent dashboards that identify the most operationally critical data events, trends, and alerts. For managers with hundreds or even thousands of nodes in an ecosystem, being able to isolate and prioritize the data they want to see in the portal is a tremendously valuable toolset. Leveraging the advanced data visualization features to their greatest extent involves the employment of dashboards with automated alerts that communicate opportunities to increase efficiency or avoid detrimental or risky use.
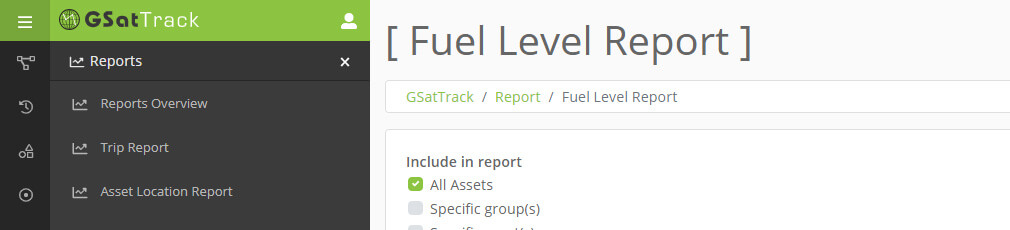
Asset managers, for example, who are responsible for the performance and efficiency of entire fleets of vehicles or vessels, can set up fuel efficiency reports that can help identify activity and use that maximizes the fuel economy of vehicles, such as average speed, RPM, and idle time.
Custom Analytical Tools
Work with your tools
Many of GSE’s clients require a custom reporting structure, custom data processing algorithms, and other analytical tools. Each of those features can be custom engineered and deployed directly to the product without a need to update the software package. Because many of these algorithms and report structures help GSE evolve the platform to suit the needs of a broader client base, it is common for GSE to deploy these custom engineering requests system-wide, resulting in a cost-free augmentation for your application.
Market specific or custom enhancements, however, are less widely applicable, and require extensive dedication of resources. For projects like these, GSE will assign a product advisor that will work with engineers and clients to find the most cost-effective way to custom-engineer the software suite to suit the needs of the organization.
External APIs and Services
Integrate with other tools
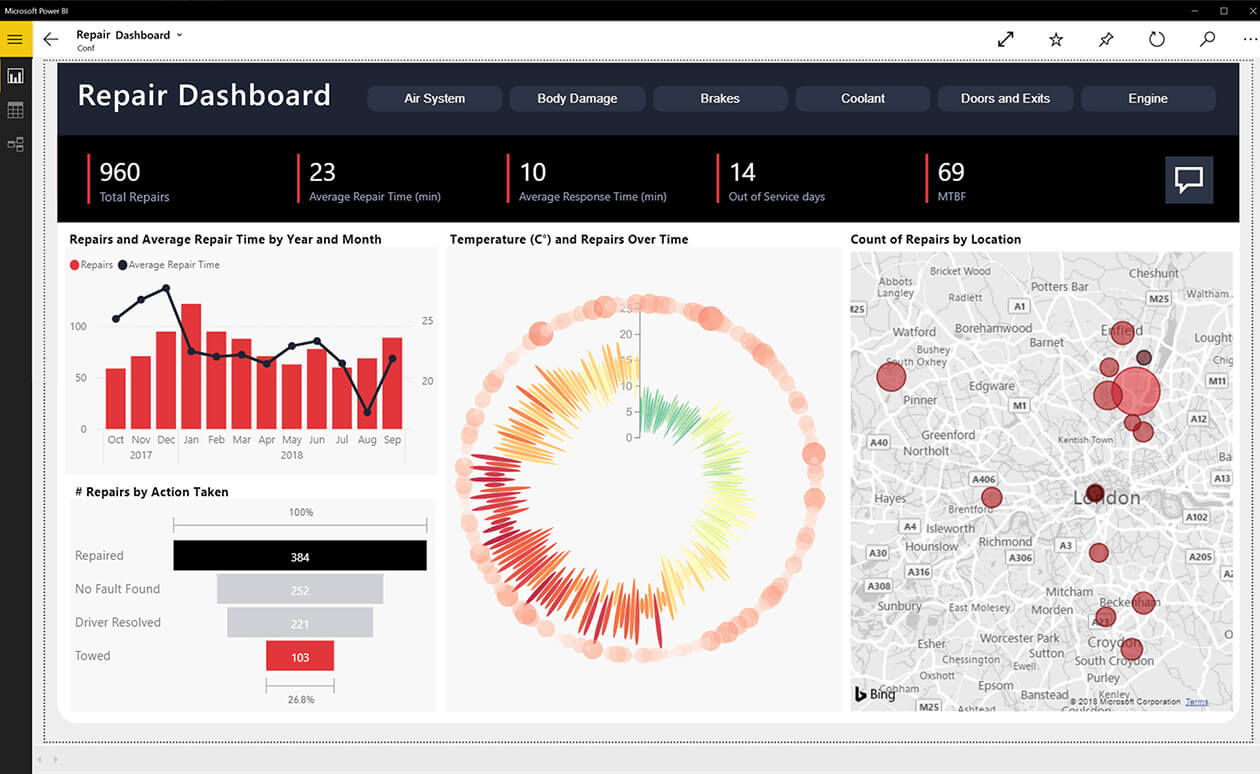
For organizations with complex legacy products and technology suites that include other applications and services, GSatTrack can be used to deliver data to or pull data from any visualization platform an organization has chosen to use, including a number of popular services like Tableau or Microsoft's Power BI. While many of GSatTrack’s API services can be found here, it is also possible to use GSatTrack Analytics as a tool to acquire data from one service, process it internally with a complex, custom algorithm, set up alerts to monitor as desired and then route it back out to any other service.
Why GSatTrack Analytics?
Best in class reporting and automation
One of the feature sets that distinguishes GSatTrack from its competition is its ability to process complex data, execute deep analytical functions, and generate reports that create actionable insights for managers and other key stakeholders. In order to maintain this advantage against its competition, GSatTrack evolves on a weekly basis, integrating new analytical tools regularly into the live product.
The analytical tools within GSatTrack are the essential engines that help organizations maximize the value of their data ecosystems and generate the most ROI. Advanced reporting, alerts, and dashboards help managers focus on the information that can maximize efficiency by identifying opportunities to save time and resources, while real-time alerts, and automation of processes or corrective actions can save organizations resources as well as lives in the most critical moments when human response times might not be as effective.
Understanding Specific Needs
Custom solutions, flexible products
GSE will help advise any organization, or any of our partner networks' clients, in order to identify the specific data processing needs each potential user will have. GSE offers its services with the understanding that a product must fit the needs of its end users, and that it is not the job of those end users to establish work-arounds. If your organization has not switched telematics software providers because of a specific processing tool, or because it has yet to find a product that does what you need to do, reach out to a GSE representative about Data Analytics tools for GSatTrack.
Begin Customizing Your Data
Reach out to learn more about Data Analytics tools for GSatTrack.
![]()